COVID-19 and Masked Crime
Warning: this article discusses crime and crime trends. Specific crimes are called out in this article and readers should be aware before proceeding.
Recently Bruce Schneier posted to his blog contemplating the potential rise of masks being utilized in crimes during COVID-19. Over the last few days, I've pondered this several times as I observe our changing times. I like to believe in the good in this world, but also fully recognize that criminals will take advantage of this time. We have already seen a staggering rise in virtual crimes, so it would be expected physical crimes would rise as well.
When trying to get a conclusive answer on this, I ran into multiple hurdles. It’s not like police departments just post to a Twitter account “robbery arrest made - masked suspect.” Finding crime reporting resources can be difficult enough, and most don’t have a data point that tells you about the suspect. However, the Internet really does have just about anything you need, and I was amazed to find that Federal and Local governments are working toward better data transparency and have been since around 2009.
The Obama administration started pushing more accountability measures by encouraging federal, state, local, and tribal governments to publish data in a standardized, accessible format. The Chief Information Officer at the time, Vivek Kundra, launched data.gov, which sought to become "a repository for all the information the government collects ... any data that is not private or restricted for national security reasons." To further this effort, President Obama issued a directive stating that OMB should inform all executive departments and agencies that they must upload at least "three high-value datasets." High value in this case was defined as "information that can be used to increase agency accountability and responsiveness; improve public knowledge of the agency and its operations; further the core mission of the agency; create economic opportunity; or respond to need and demand as identified through public consultation." Over the last 10 years, the available datasets have expanded greatly. 198 organizations are officially recognized on data.gov, with 48 state governments reporting data and 48 counties or cities reporting data to date. Most major cities are reporting in, but looking at the map on data.gov, some states are noticeably absent.
With these databases publicly available, it is very easy to look at major metropolitan police reports to get a general feel for crime trends. I picked San Francisco, Chicago, and New York City for this research for their differing geographic location and Covid-19 case rates. While each of these cities are significantly impacted by Covid-19 due to population density, New York City has become the epicenter for the pandemic in the United States.
Schneier's original link to AP News specifically calls out that all crimes may benefit from our new habit of donning masks, so first let's look at overarching crime data.
Leveraging a quick Google search for “Open Data New York City” leads us to gold on the first hit - New York City’s OpenData portal. These OpenData portals contain more than just crime data. There are databases for Taxi Cab driver registrations, records for 311 informational calls, permits for filming, and parking violation records. Most importantly, this data can be viewed, manipulated and even visualized in your browser. Talk about radical transparency and empowerment. I am after crime statistics so I focused in on 2020 NYPD arrest reports, with the caveat that not all crime goes reported, especially in a time when we are supposed to be staying away from other people. This data is only updated quarterly, so analysis is only possible on the first few months of the year and then the beginning of Covid-19 in the United States. Opening the database in visualization mode, I decided to group everything by ARREST_DATE and first group hits by day, and then month. No matter which way you look, there is a significant drop in overall crime. Once this data is updated again, April and May data points will be available, and it wouldn't be surprising to see a continued downward trend or lower activity levels compared to January through March data points.
With each of these views, we see the dramatic drop in arrests begin happening around mid-March:
NYPD 2020 arrest data YTD - grouped by day

NYPD 2020 arrest data YTD - grouped by month
These dips could be situational or could be an insular trend in one of the hardest hit cities during the pandemic. Let’s see what the data says as we move across the country.
Once again a simple Google search for “Open Data Chicago” leads us straight to Chicago’s OpenData portal through the top result. Chicago provides a search function to use keywords to find the dataset you need, but once again a myriad of diverse datasets is available to anyone who goes digging. A simple search for “crime” yields results dating back to 2002. The possibilities with this data are staggering. Chicago keeps it simple with 2020 crime reports, updating records daily and providing several more fields than New York City. Chicago has not garnered the same kind of international headlines as New York City regarding how hard the city was hit with Covid-19, yet we can see a similar downward trend for all general crime. Though when grouping by day there are still peaks, those peaks are lower than pre-quarantine days. When grouping data by month, a staggering downward trend can be visualized better. Like New York City, starting around mid-March overall reports drop drastically and continue to fall to staggering numbers. The very recent data provided by Chicago supports the theory that New York City’s crime reports will follow the same downward trend when new reports are added to their 2020 database.

Chicago PD 2020 crime data YTD - grouped by day
Chicago PD 2020 crime data YTD - grouped by month
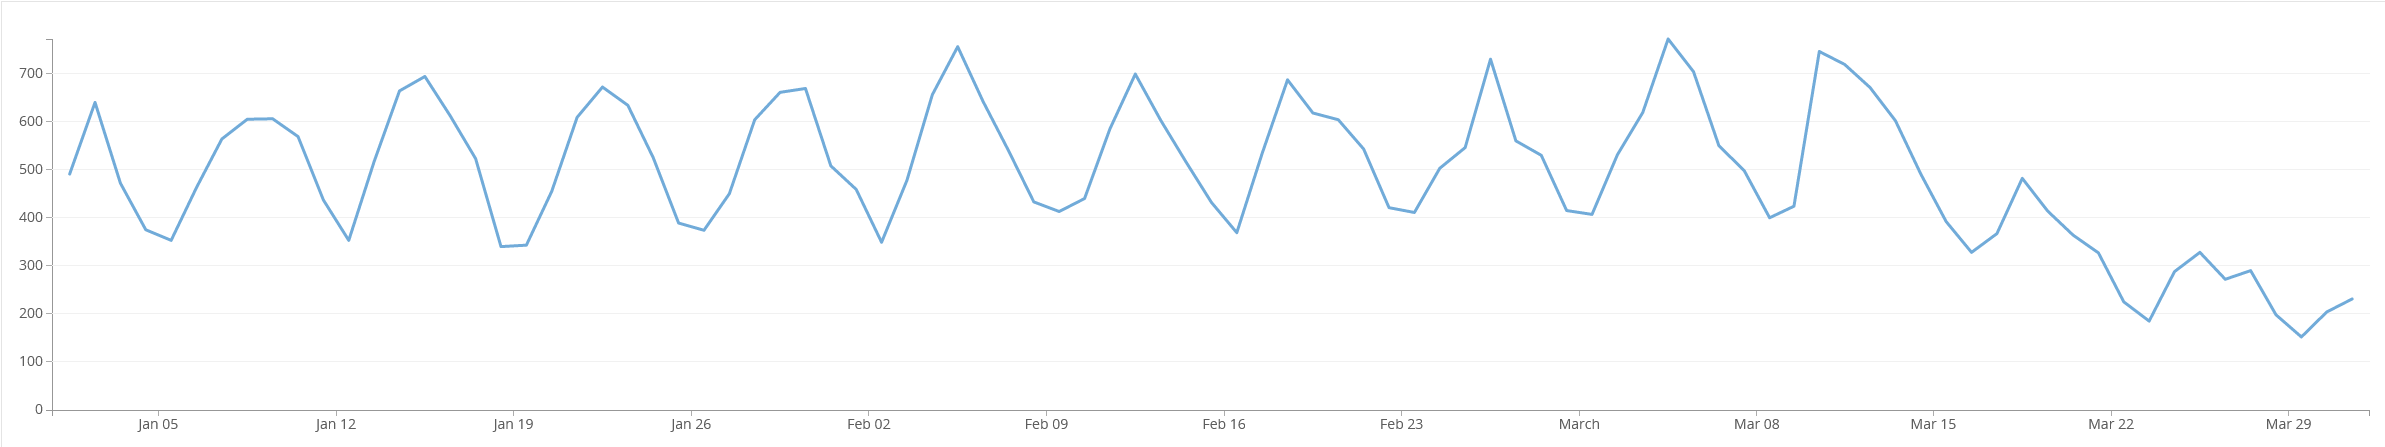
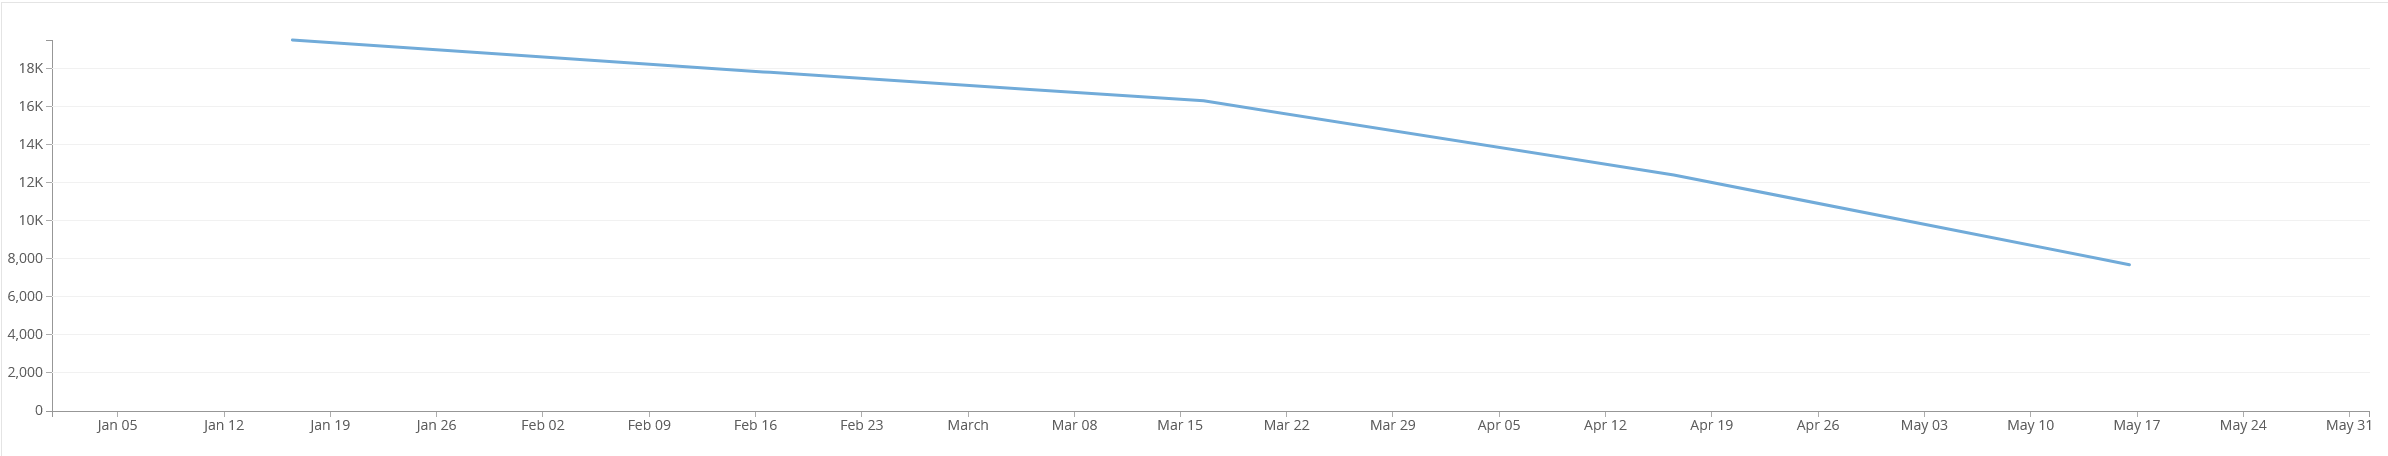
Finally, using the same discovery method for New York City and Chicago, I was able to find a fantastic OpenData portal for San Francisco. The 2020 crime data from San Francisco matches the same trend as New York City and Chicago, all while being updated recently as well. When looking at overall reports by day, there is a noticeable drop between days starting around March 12th. When grouping by month, again the dramatic crime drop is visualized, highlighting a drop from 12k cases in January to around 8k in April, and a further drop into May.

San Francisco PD 2020 crime data YTD - grouped by day

San Francisco PD 2020 crime data YTD - grouped by month
Given this initial data research, it is clear all reporting of crime is down and arrests are down. This could be due to more people staying at home or because criminals are evading arrest by leveraging masks or more likely, because even robbers fear getting Covid-19. When we think about the original question, “just how many criminals are taking advantage of the pandemic to commit crimes?” it is important to distinguish what crimes would benefit from the adoption of masks in society. Looking at the guidance issued by the FBI in the National Incident-Based Reporting System (NBIRS) user manual in 2019 it is revealed each offense should fall in one of three categories:
Crimes against person
Crimes against property
Crimes against society
Since overall crime is down, to really answer the question if criminals are using masks to their advantage, we need to define what crime benefits from anonymity. In each of the NBIRS categories, there are several offenses that benefit. From the start, we can rule out drug offenses and prostitution. In these cases, the “suspect” often is not trying to hide their identity because they are not committing a crime against an individual or property. This isn’t research on morality of crimes, but the benefit to the suspect of using a mask during the crime is low to none. Similarly, white collar crimes can be ruled out, these suspects are usually committing crime virtually or via the phone and a mask has no benefit. Any crime committed where the suspect is known to the victim automatically loses any perceived anonymity from a mask. None of these facts make any of the crimes any less heinous. In order to determine if masks are providing any advantage to criminals, we must look at crimes where being unknown is power - arson, theft, robbery, burglary, property damage, sexual assault, physical assault, homicide, abduction, or trespassing.
The difficult part about categorizing what crimes are aided by masks or facial covers is that not all OpenData portals categorize crimes the same. Not all databases contain the same information even, so narrowing down our results can be difficult and at times, a guessing game. Using this new criteria, let’s look at our data again. I will include the crimes in focus for these new queries.
Beginning on the east coast again, I drilled into New York City. This time I filtered on crimes fitting the description discussed above: ASSAULT 3 & RELATED OFFENSES, PETIT LARCENY, FELONY ASSAULT, ROBBERY, GRAND LARCENY, BURGLARY, CRIMINAL TRESPASS, OTHER OFFENSES RELATED TO THEFT, GRAND LARCENY OF MOTOR VEHICLE, MURDER & NON-NEGL. MANSLAUGHTER, OFFENSES AGAINST THE PERSON, RAPE, THEFT OF SERVICES, KIDNAPPING &RELATED OFFENSES, ARSON, HARRASSMENT 2, NYS LAWS-UNCLASSIFIED FELONY, CRIMINAL MISCHIEF, JOSTLING.
The result was the same, a consistent downturn in arrests related to those crimes:

NYPD 2020 arrest data YTD - grouped by day - filtered

NYPD 2020 arrest data YTD - grouped by month - filtered
Again, not every police department codes reports the same way. Moving to the Midwest, we see a distinct change in Chicago PD’s categorization of crimes and a change in the filter that must be applied. Chicago has more descriptive offense categories and a wider range of offenses to utilize. The offenses selected for the filter here were: THEFT, BATTERY, CRIMINAL DAMAGE, ASSAULT, MOTOR VEHICLE THEFT, BURGLARY, ROBBERY, CRIMINAL TRESPASS, CRIMINAL SEXUAL ASSAULT, HOMICIDE, CRIM SEXUAL ASSAULT, ARSON, STALKING, KIDNAPPING, INTIMIDATION, HUMAN TRAFFICKING.
Once again, the data shows that there is a drop in crimes reported in this nature, though the difference in the day grouping is somewhat negligible:
Chicago PD 2020 crime data YTD - grouped by day - filtered
Chicago PD 2020 crime data YTD - grouped by month - filtered
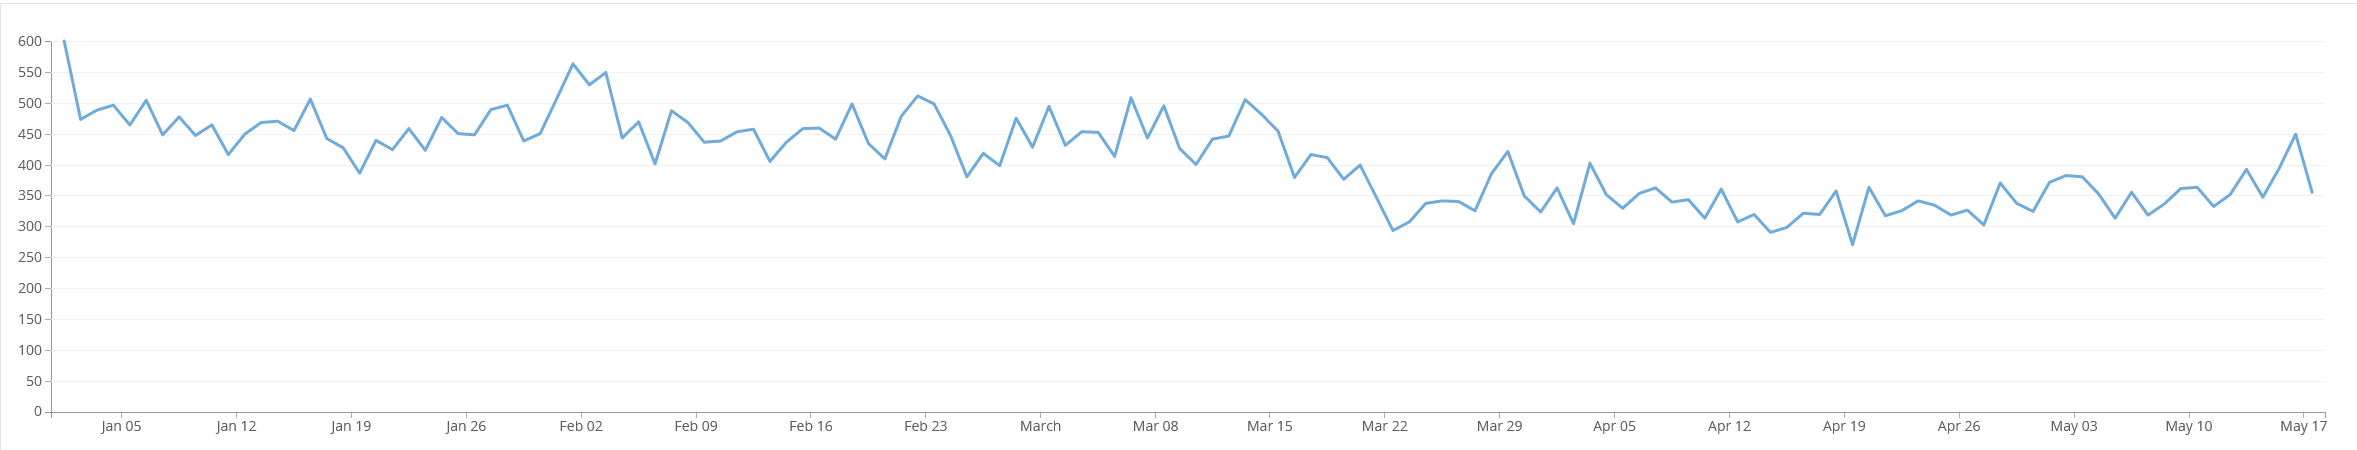
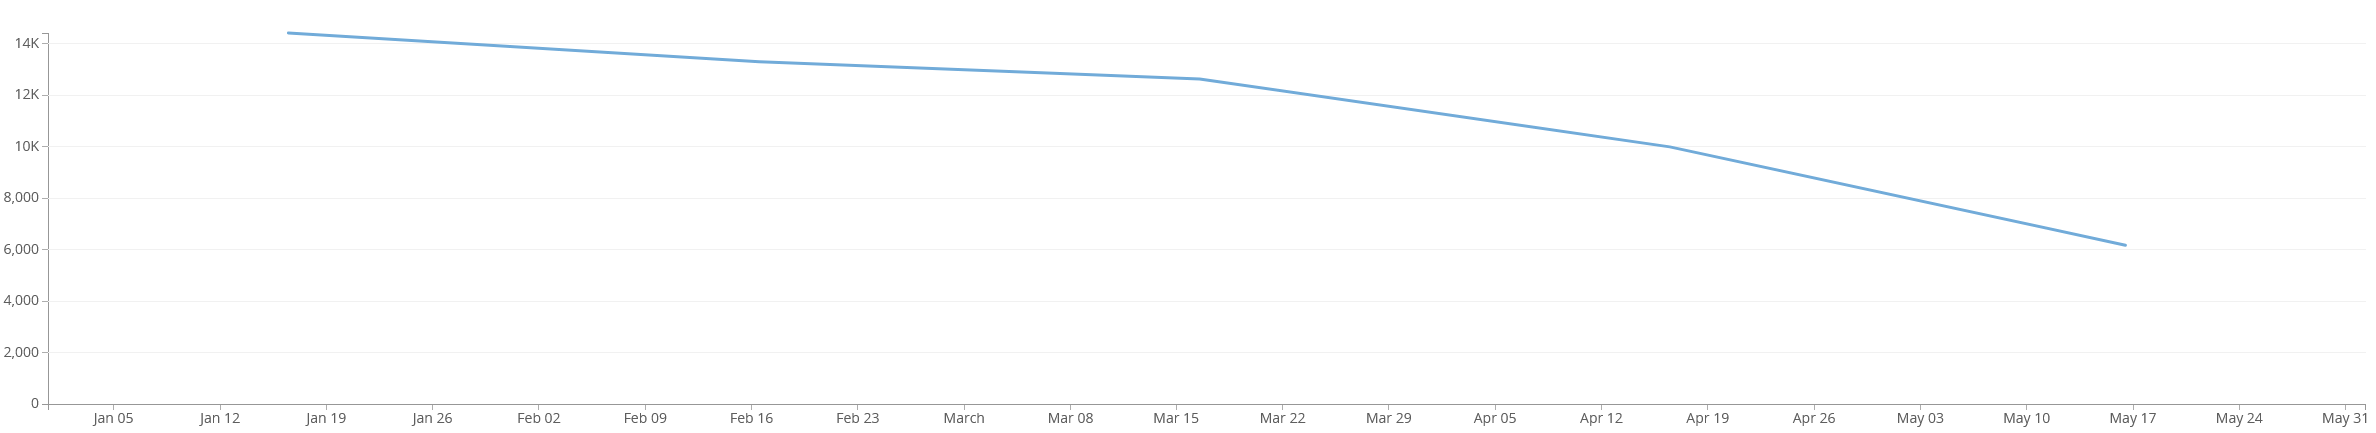
Finally, a second look at San Francisco crime data. San Francisco has a much more detailed coding system, making it necessary to get primary offenses filtered and then filter further on secondary category offenses. Alternatively, the Incident Description field can be leveraged, but there are significantly more entries and “Other” descriptions still exist which leave more questions than answers. The filter used for San Francisco data is: Larceny Theft, Other Miscellaneous, Malicious Mischief, Burglary, Assault, Motor Vehicle Theft, Robbery, Suspicious Occ, Stolen Property, Arson, Vandalism, Rape, Human Trafficking (A), Commercial Sex Acts, Human Trafficking, Commercial Sex Acts, >Motor Vehicle Theft?, Homicide.
The results show once again, a downward trend in crimes:

San Francisco PD 2020 crime data YTD - grouped by day - filtered

San Francisco PD 2020 crime data YTD - grouped by month - filtered
Even in the categories where criminals would benefit, overall police data shows a drop. Still, there is no concrete evidence in these databases that show if a suspect was masked or not. A more valuable dataset would be 911 calls with description fields filled out. Since the datasets provided by the city are based on the suspects who are caught by police departments, there is a general unknown of suspects who were not caught. The best way to get a real idea of actual crime increase or decrease would be based on 911 call rates compared to arrest rates. Using that data, you could pinpoint the difference in number of reported potential offenses vs observed and caught offenses. If the ratio between potential offenses reported vs caught increases, it would be a fair assumption that masks may be benefiting criminals, since police cannot use an accurate description of suspects to catch offenses.
There is not enough data to confidently say criminals are benefiting from masks becoming commonplace in society. Criminals have tried to mask their identity as far back as history goes. Now the news stations are preying on our latest fears, so these masked offenses rise to the top of our mind, when the data does not support the theory that more criminals are taking advantage of masks. The data shows that crimes are universally down.
I decided to check one other data point to determine if masked crime is on the rise. The news is a powerful tool in our country, and can bend public will to influence elections, travel patterns, or even fashion trends. For this I tried to use Google News, but there is not an API. For a quick manual temperature check, it is great, but for larger scale data manipulation, I prefer an API. This is where Newsriver comes into play. Newsriver is “the first API providing daily access to hundreds of thousand news articles consistently harvested from The Internet and processed with cutting edge Artificial Intelligence technology.” It is an incredible, free service that I will absolutely be donating to for their help with this project. With a simple curl call populated by their GUI search parameters, I was able to look for all news articles with “masked” in the title, “suspect” and “police” in the body, and remove all instances of “The Masked Singer” which I didn’t care to read. The results came in a clear JSON that I was able to manipulate with jq.
The result was up to 100 articles from around the world that related to masked crime. Ultimately, news stories about masked suspects involving the police are down this year, with a small spike in April.
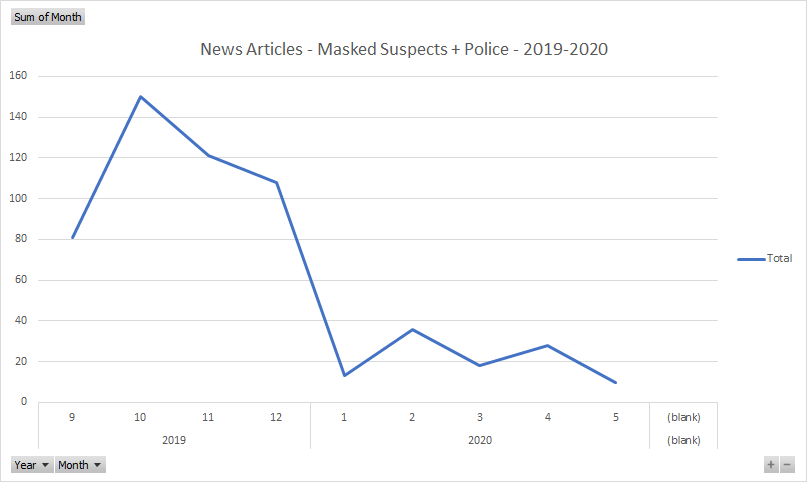
Newsriver.io results for articles regarding masked suspects involving the police - 100 articles - 2019-2020
What about removing the criteria of including “police” in the article? There are few political articles to remove, but the downward trend persists.
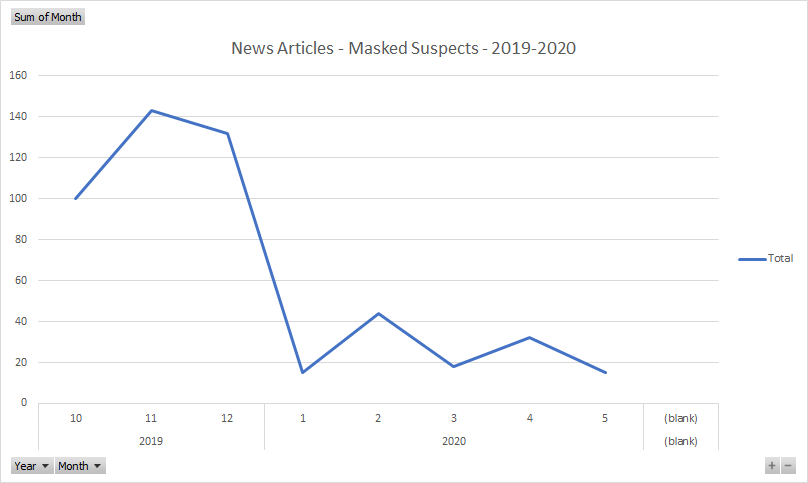
Newsriver.io results for articles regarding masked suspects - 100 articles - 2019-2020
News reports show less masked criminal activity through the pandemic as well. This data gives me a moderate amount of confidence that criminals aren’t using masks to commit more crime than average. There are holes that can be poked in this data and analysis, and that is okay. Finding a high confidence answer requires access to data that is sensitive and shouldn’t be in the hands of just anyone. The overarching theme is that crime is down during Covid-19. At least in the thick of the pandemic, criminals are trying to stay safe too. There may be an uptick in crime as we come out of the pandemic, and jobs that existed in January are potentially gone forever. For now, it seems things are slower than usual as the country crawls into summer and people try to avoid becoming another statistic.
Did I miss an awesome data source I could have used? Suggestions on crime categorization resources? Want to talk about other ways to track potential masked crimes? Email at lauren@laurenproehl.com or reach out on Twitter - @jotunvillur. I’m always excited to talk more.